Career Data Charts
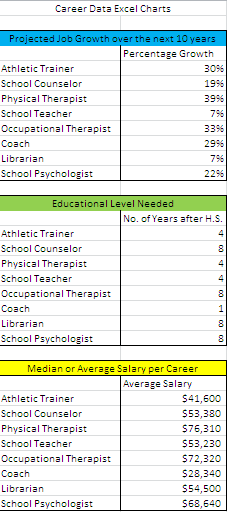
a) In this assignment I had to create three tables in excel using my Career research data. In these charts I plotted the percentage job growth over the next 10 years for each of my 8 jobs, as well as the educational level needed in years and the average salary for each. After creating these charts, we then used them to create three graphs which are helpful to see the highest and the lowest in each of these catergories.
b) In order to complete this assignment, I had to create and format three tables as well as three graphs. These items also included labels and the auto fill feature in order to add color.
c) By creating this excel spreadsheet, I learned how to format a graph using a background color as well as the use of even a pattern
d) I formated charts as well as each graph well with specific color schemes
e) I would use different color schemes as well as change up the format overall
Physical Therapist Glog
a) In this assignment I had to create a Glog on Glogster.com in order to represent my career choice, Physical Therapy. In this glog I included a description of the job as well as skills and education in order to fulfill a job in this career field.
b) In order to complete this assignment, I had to use design tools from glogster as well as include each of the requirements needed to accuritely describe my career.
c) By creating this glog, I learned how to use various design tools and how to embedd a video into a glog.
d) I used my design tools well in order to make my glog visually appealing as well as educational to the viewer.
e) I would change up the overall organization of my glog as well as the color scheme.
Final Multimedia Reflection
For the last few months, our MS Office class has had the opportunity to experience and use many forms of multimedia such as pixorial and glogster. I enjoyed using multimedia because it allowed me to incorporate my style and artistic ability into something technology related. The glog I created on glogster combined my creativity as well as my knowledge on my given career. It was both educational to make as well as fun because this form of multimedia expresses information in a new and exciting way which is a lot more appealing then just a plan word document or a power point. Pixorial allowed me to learn how to edit videos and actually sparked my interest in it. Just like glogster, using a video with many other forms of multimedia is another way that expresses information in a more creative and appealing way. The pixorial project allowed me to use my imagination in every aspect such as filming, directing, and editing. Overall, I enjoyed working with multimedia such as pixorial and gloster and I will definitely incorporate and use it for my future school projects and assignments.
