37 Stocks
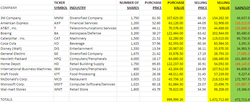
a) In this assignment, I had to create a spreadsheet of companys who invested in stocks and what there prices and gains/loses were.
b) In this assignment, I had to use the auto sum feature in Excel to add up totals as well as type in formulas with the drag down feature.
c) I learned how to use the auto fill feature to color code my stock chart.
d) I used the auto fill feature as well as filled in the formulas to calculate Purchase and Selling values.
e) I would pay attention alittle more to my typing of numbers because in one row i messed up one number and it caused the whole chart and formulas to be thrown off.
Excel #22
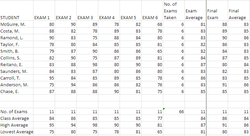
a) In this assignment, I had to create a spreadsheet in Excel which included a class roster with 6 exam grades for each student. I also had to calculate how many exams each student had taken and what there exam average, final everage, and final exam grade was. Lastly, we had to calculate the class average for each test, the highest average on each test and the lowest average on each test.
b) In this assignment, I had to use the auto sum feature in Excel as intergrade the use of formulas into my spreadsheet.
c) I learned how to use formulas to calculate averages overall for the class which was extremely helpful because in my life i want to be a teacher.
d) I used the auto fill feature as well as typed in formulas to calculate each average.
e) I would get better with typing in formulas and numbers because I messed up on a few of those which in return messed up my finished calculation in the end.
Line Chart Project (PowerPoint)
a) In this assignment, my group and I had to create a power point in order to teach our classmates how to correctly create a line chart.
b) We had to create this presentation in Microsoft PowerPoint which had to be visually appealing as well as educating to our classmates.
c) I learned how to add designs and layouts to power points and how to add pictures in order to show steps to the process of inserting and creating a line chart.
d) I used to the design and layout tab as well as the auto fill features and word art. I also used the snipping tool to screen shot each step of inserting a line chart to make it easier for my classmates to follow along and learn the process.
e) I would change the design and layout colors as well as maybe go into a little more depth with each step but overall I believe that my groups power point efficiently depicted and taught my class how to insert and create a line chart.
Line Chart Project (Excel)
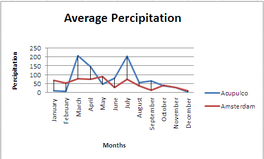
a) In this assignment, My group and I had to create an excel spreadsheet that our classmates had to do after listening and learning how to insert a line chart from our power point (shown above).
b) We had to create this spreadsheet in order to test our classmates skills of inserting line charts which they learned in our presentation.
c) I learned how to change and chose the layout and design of the final line chart as well as create one.
d) I used the design and layout tab in order to change the style and the color of my line in my line chart as well as inserting titles.
e) I would change the angle of my labels on my axis' as well has the colors of my lines. I would also chose a different layout so that the lines attaching the two lines together wouldn't be there.
50 Yacht Mortgage
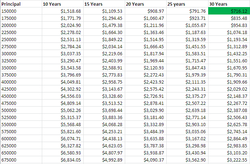
a) In this assignment I had to create an excel spread sheet portaying various Yacht Mortgages that people.
b) I had to create this spreadsheet in order to fill out and find what the mortgages would be over the course of 5 years from 10 years to 30 years.
c) I learned how to use the auto fill throughout various columns to fill up a whole excel sheet with the morgages that each person payed for their Yacht.
d) I used the auto fill feature as well as the high lighting too throughout the mortgages.
e) I would change the effeciency of how I finished my excel spreadsheet as well as the highlighted colors used.
